
The Big Muddy
Context
It doesn’t take an environmentalist or a historian or an economist to observe that bodies of water tend to bring people together. Whether out of necessity, convenience, commerce, pleasure, or without digressing too far into the philosophical or the religious, out of the innate representation of life, renewal, and certain subconscious currents or tides (awful pun intended) that draw us to our beautiful bodies of water on earth.
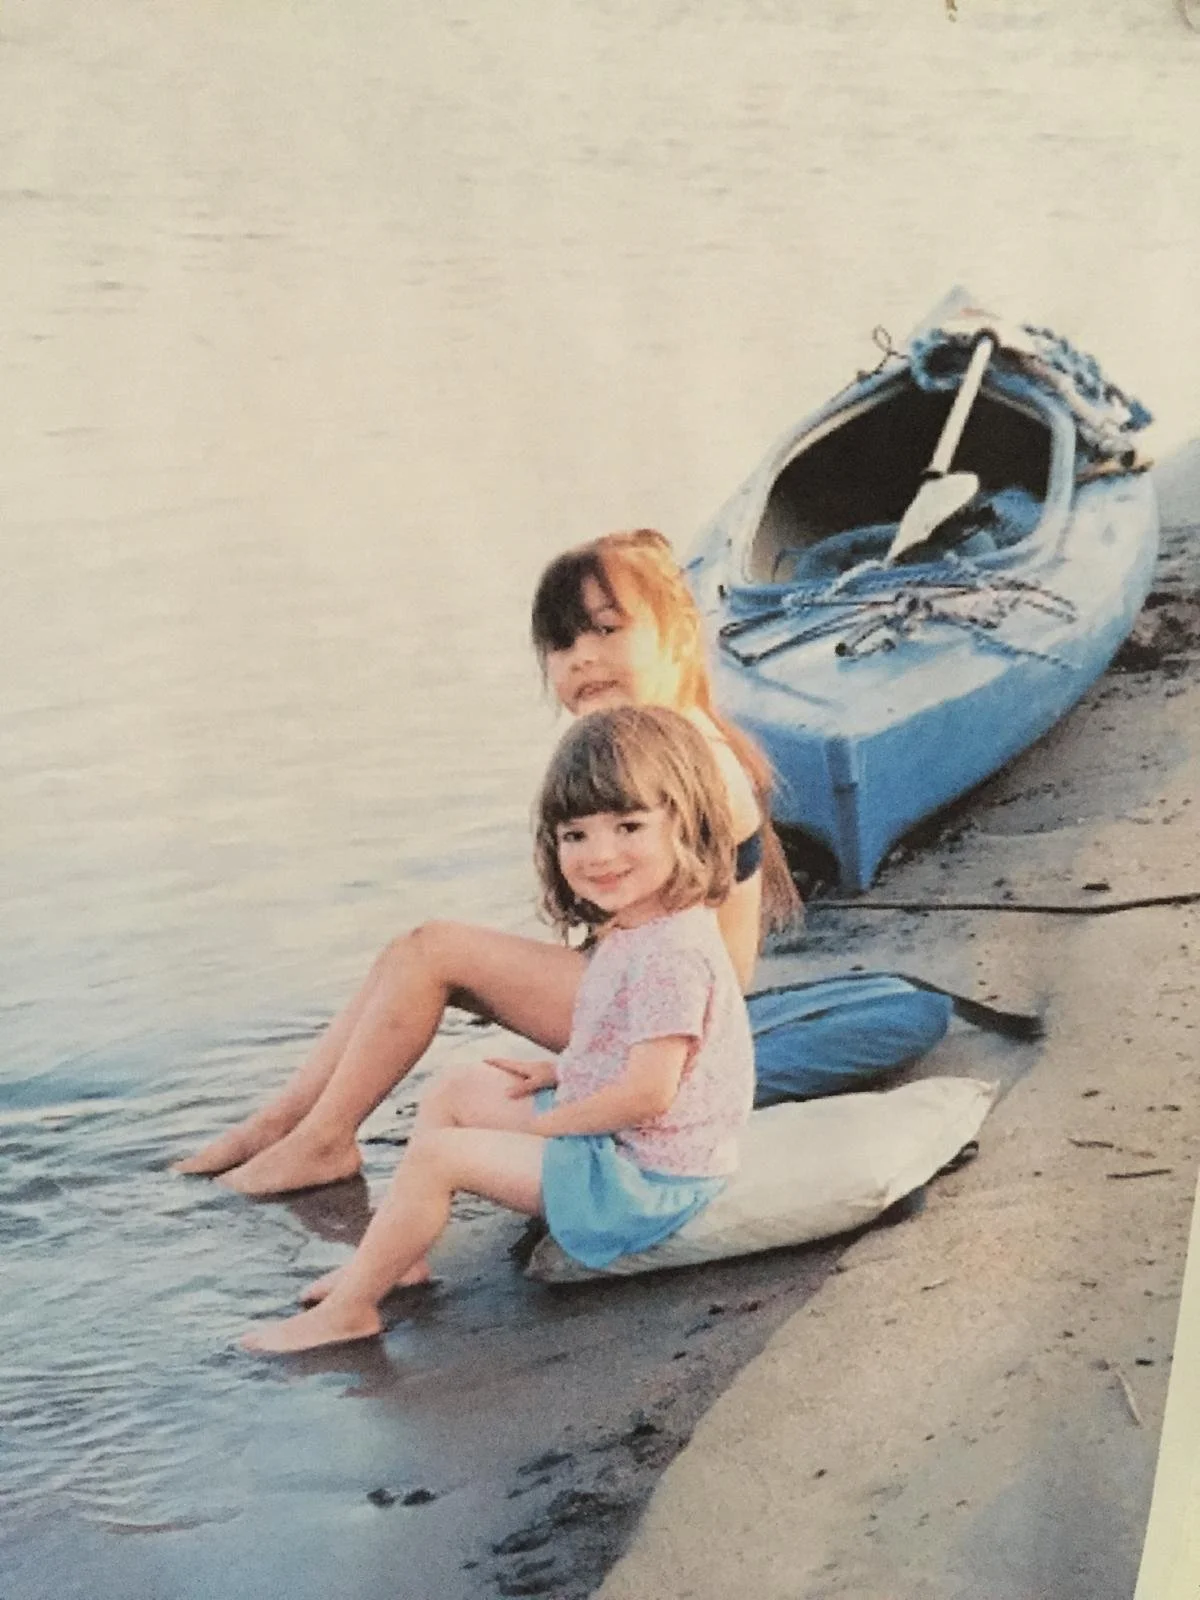
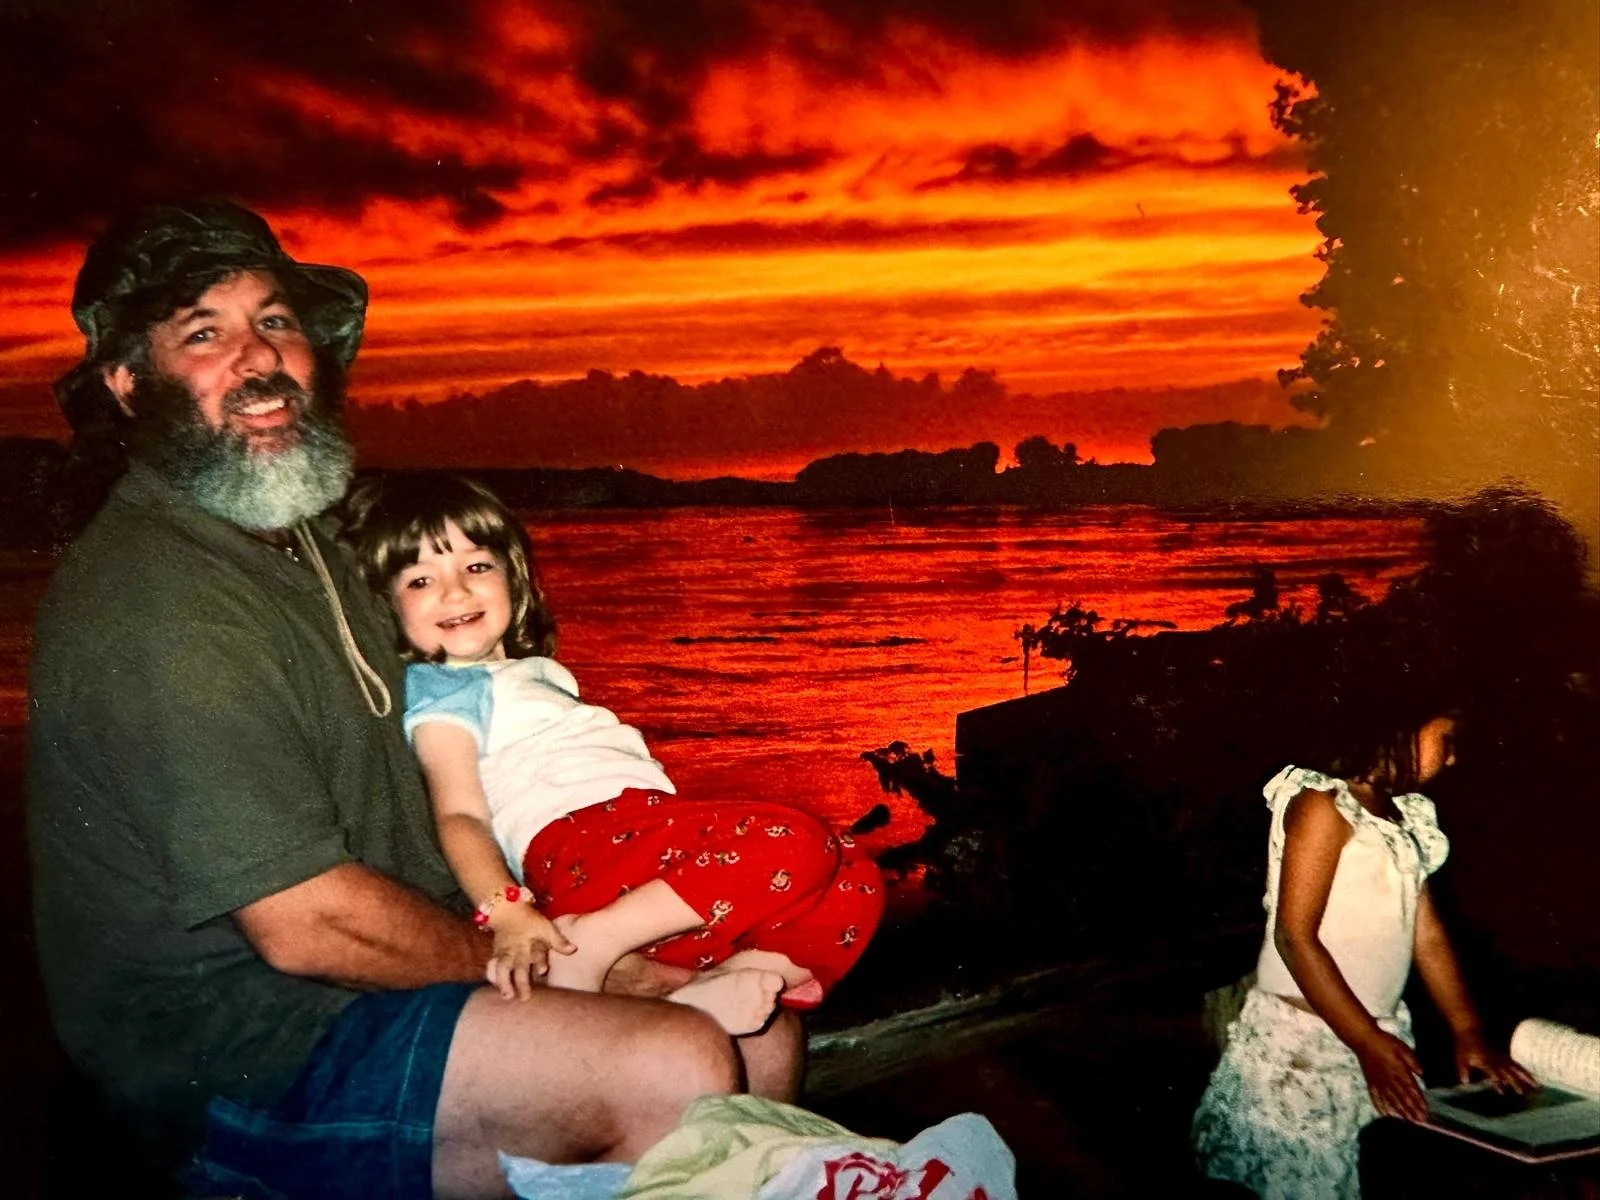
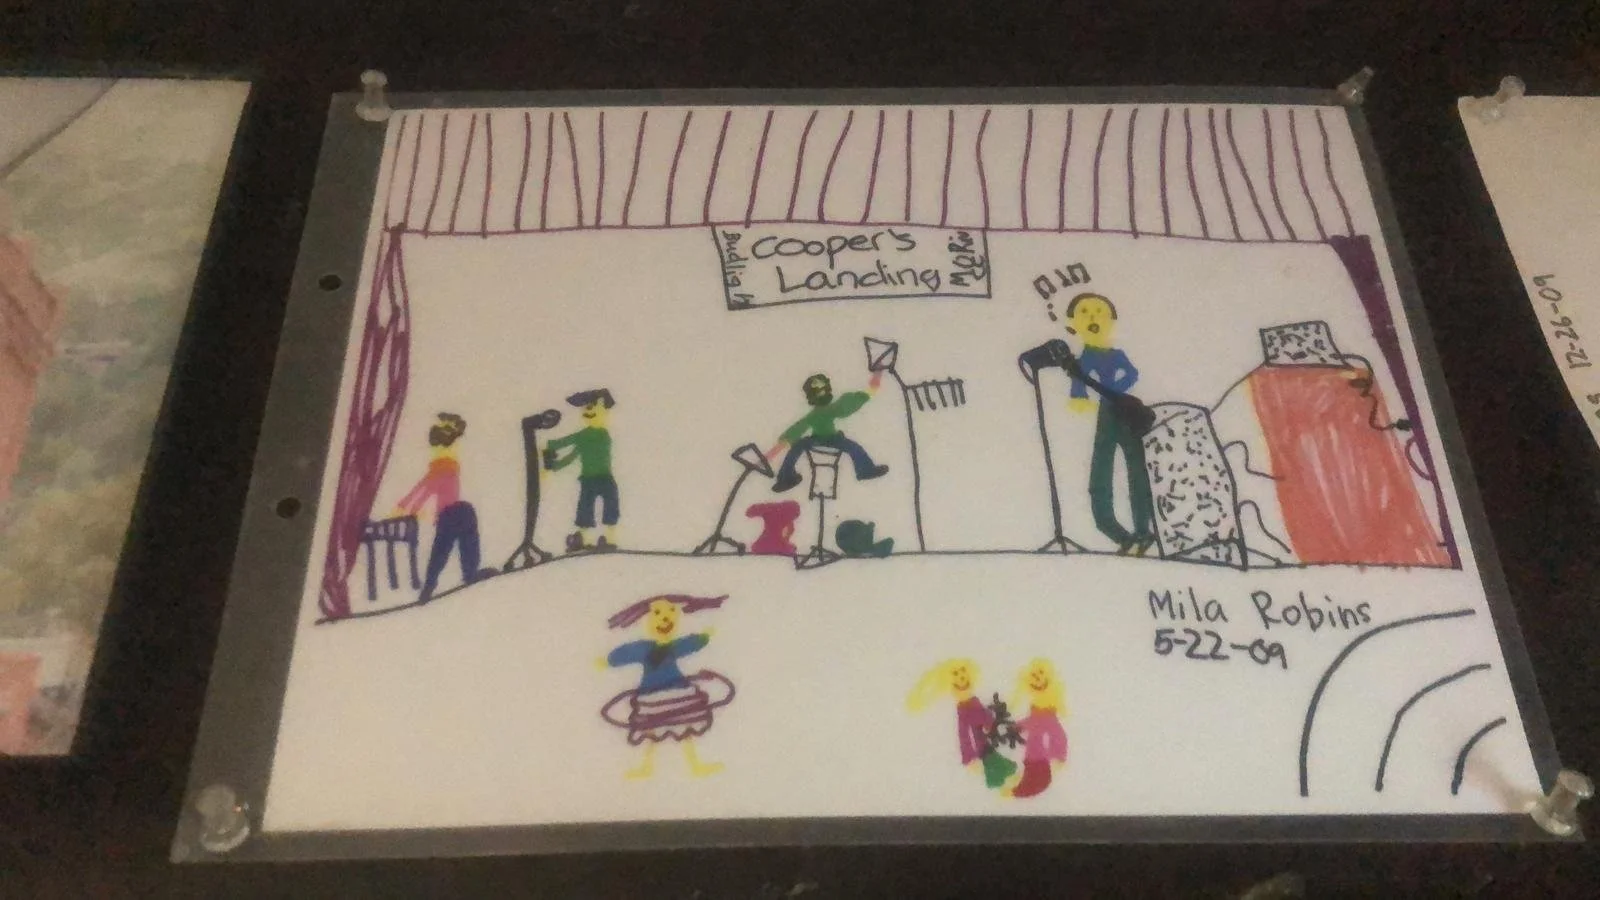
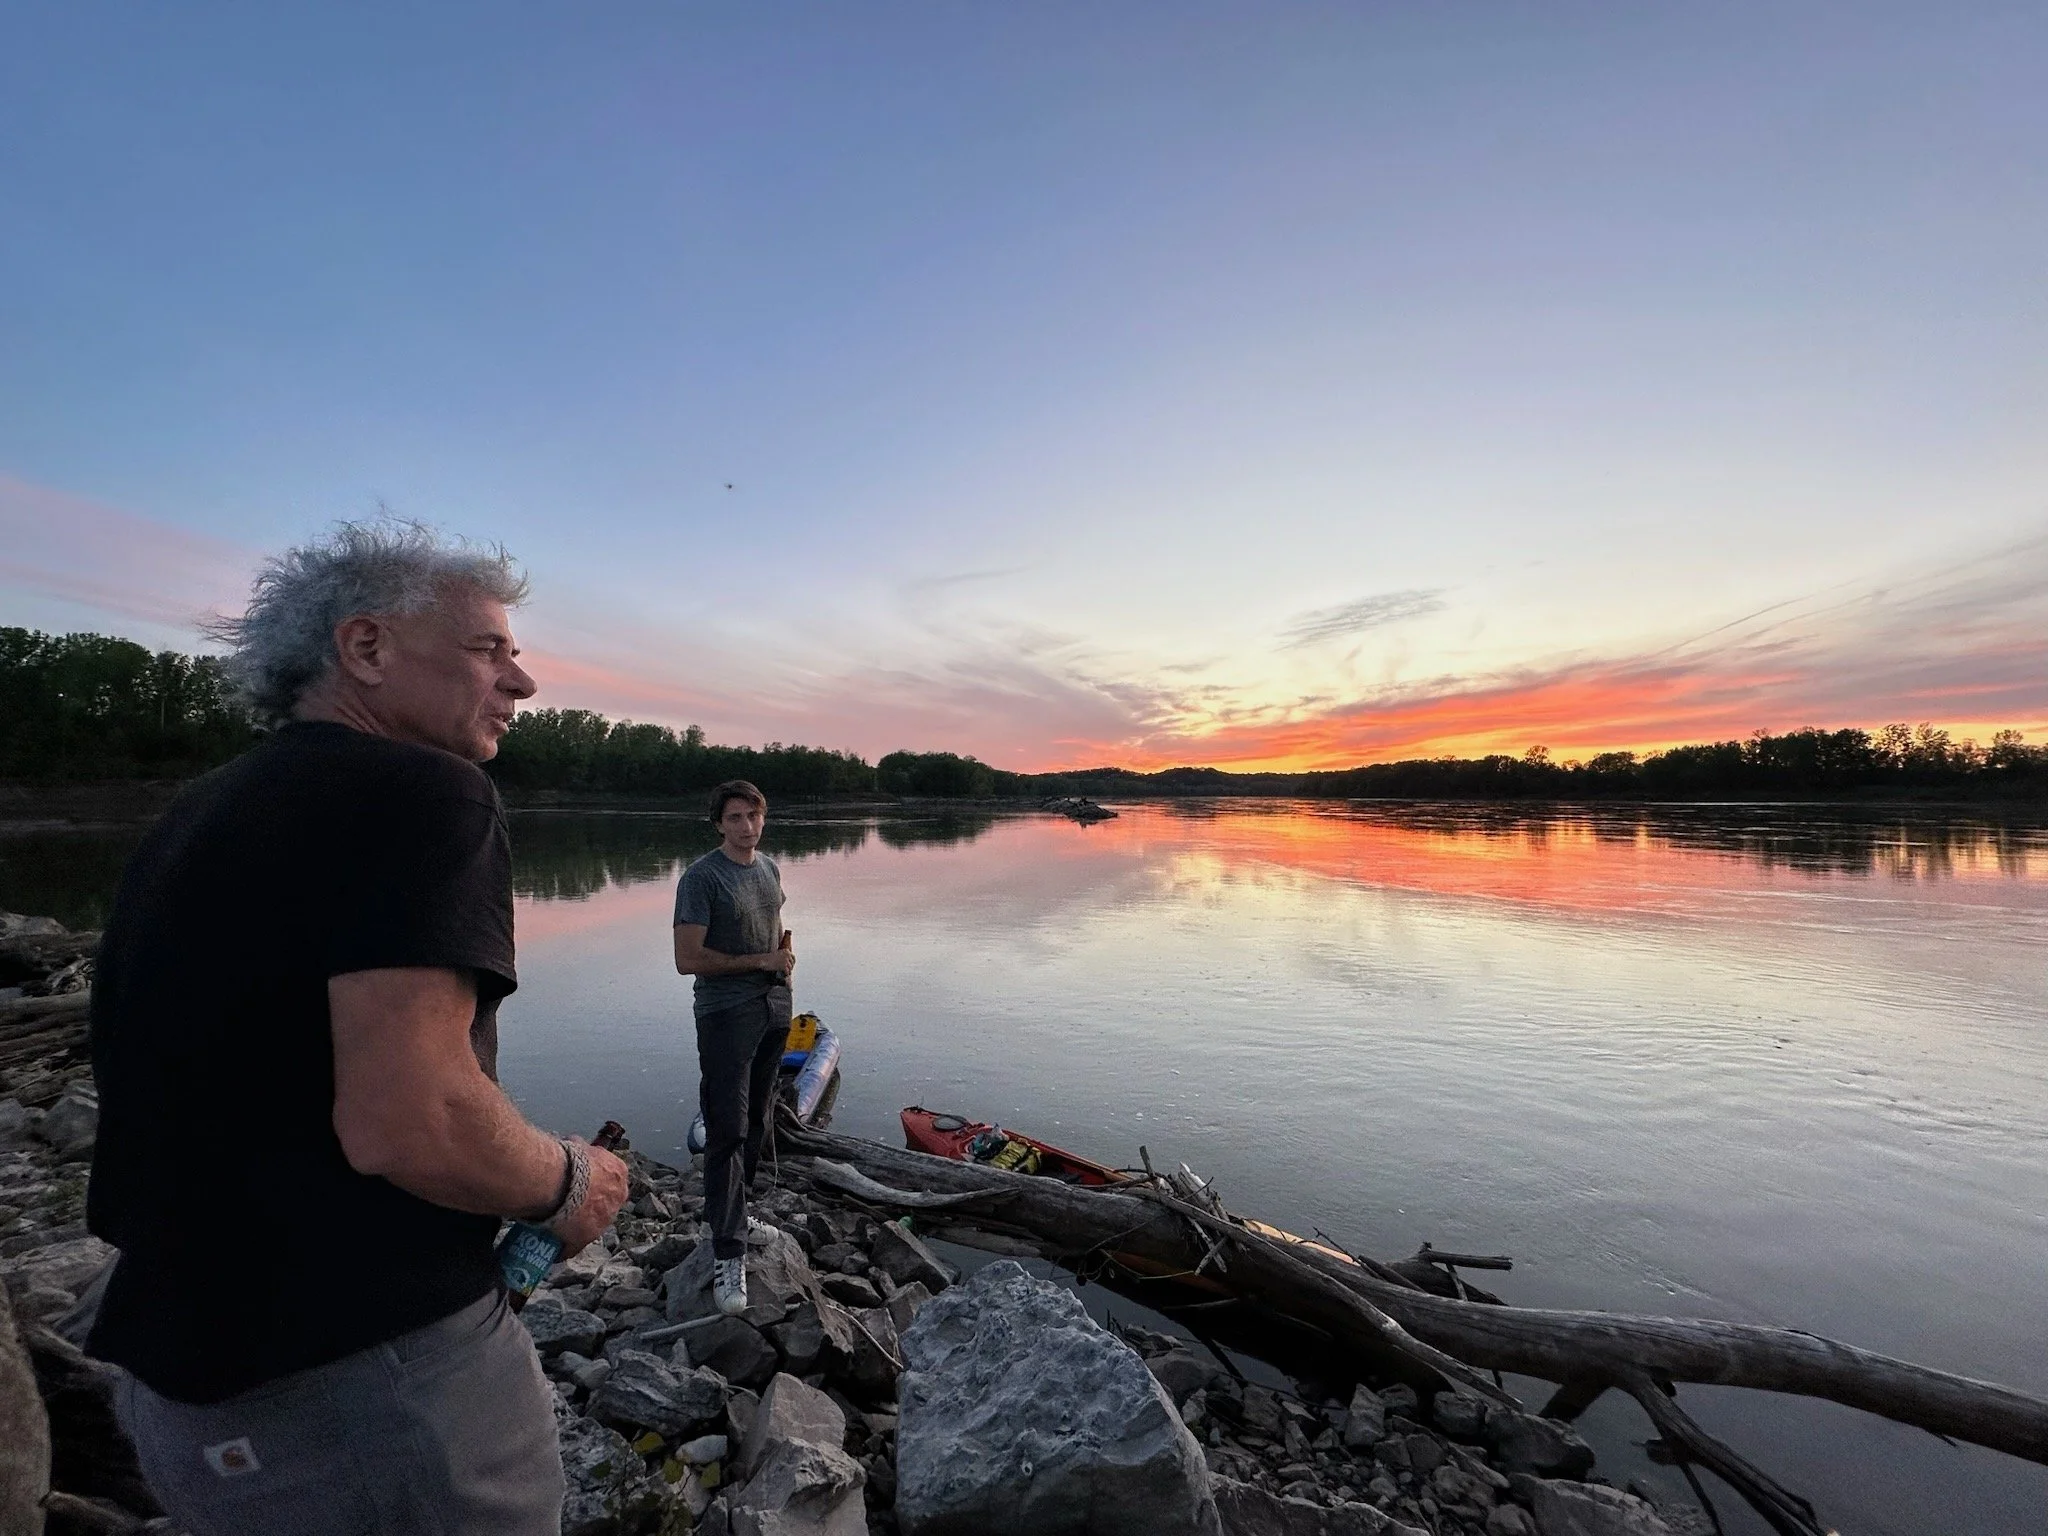
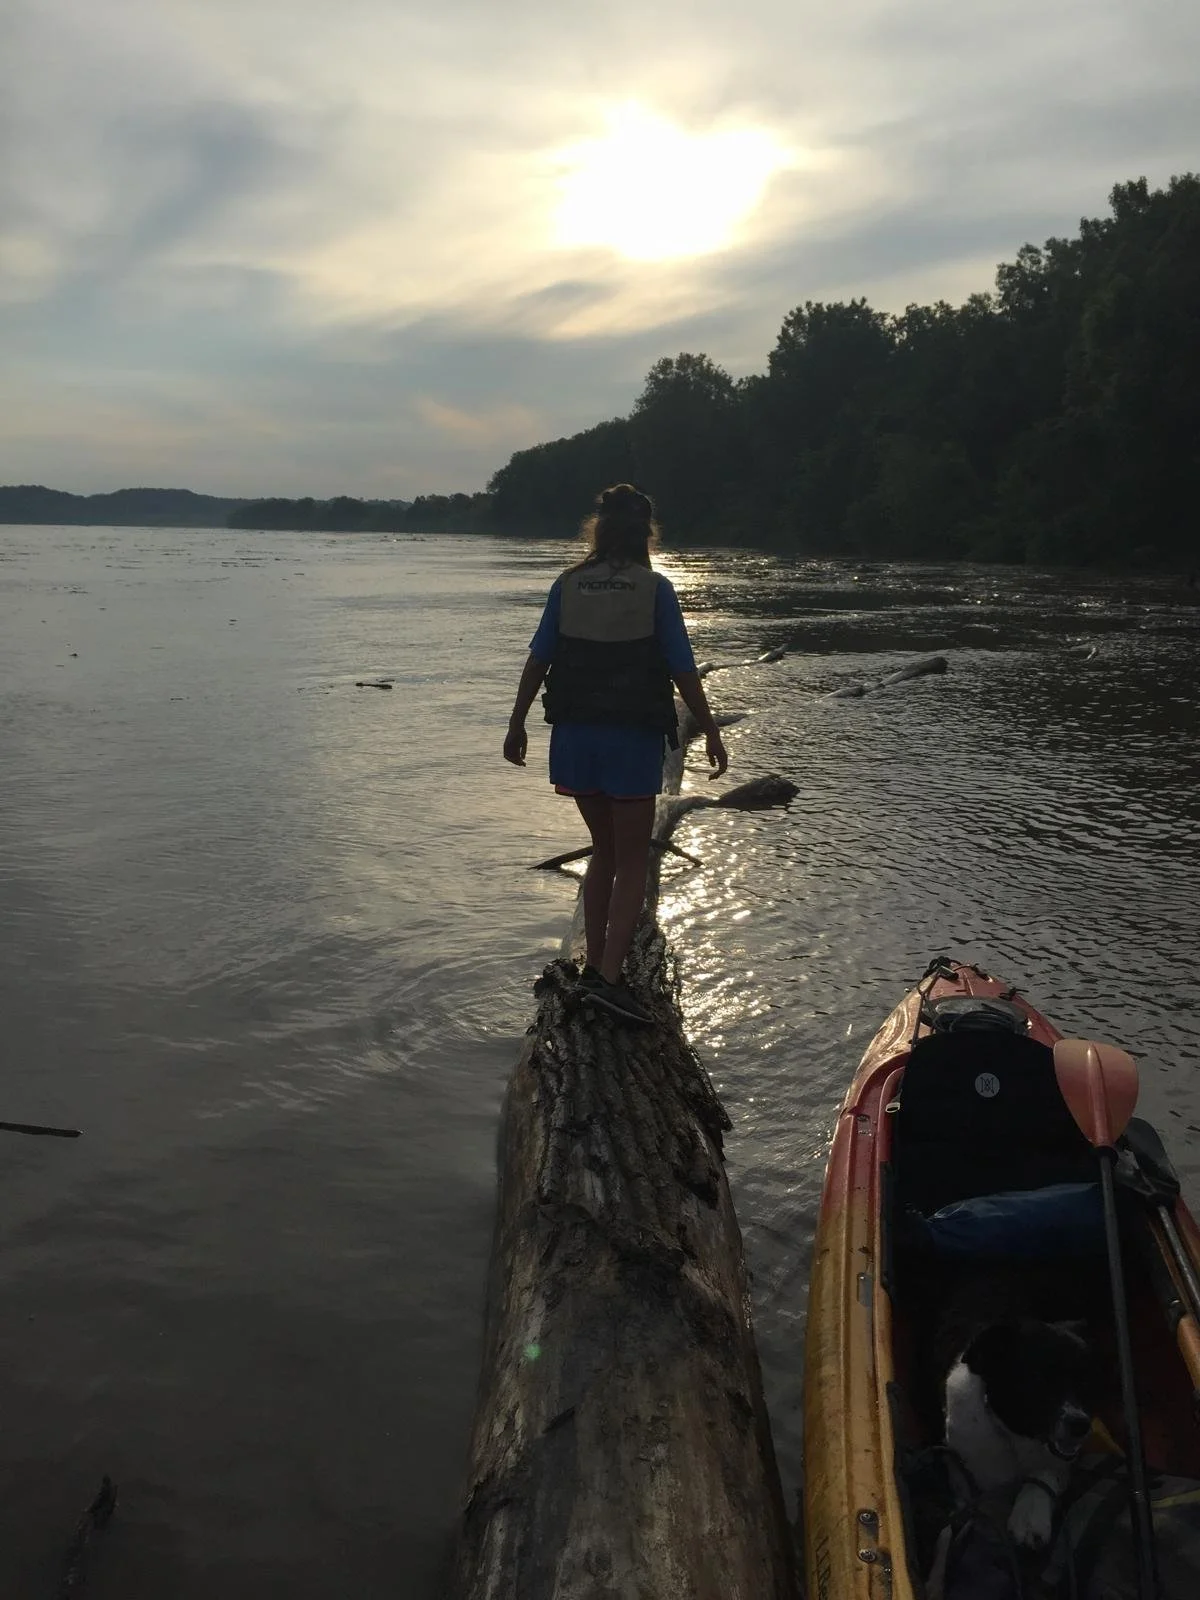
I grew up on the banks of one of these bodies of water: the Missouri River (The Big Muddy). A good portion of my formative years (aged 0-16) were spent kayaking upstream with my father and our dog, sitting around bonfires on the banks, on sand-bars and islands, or at Cooper’s Landing, a riverside marina one may call it in efforts to glamourise, in Boone County Missouri.
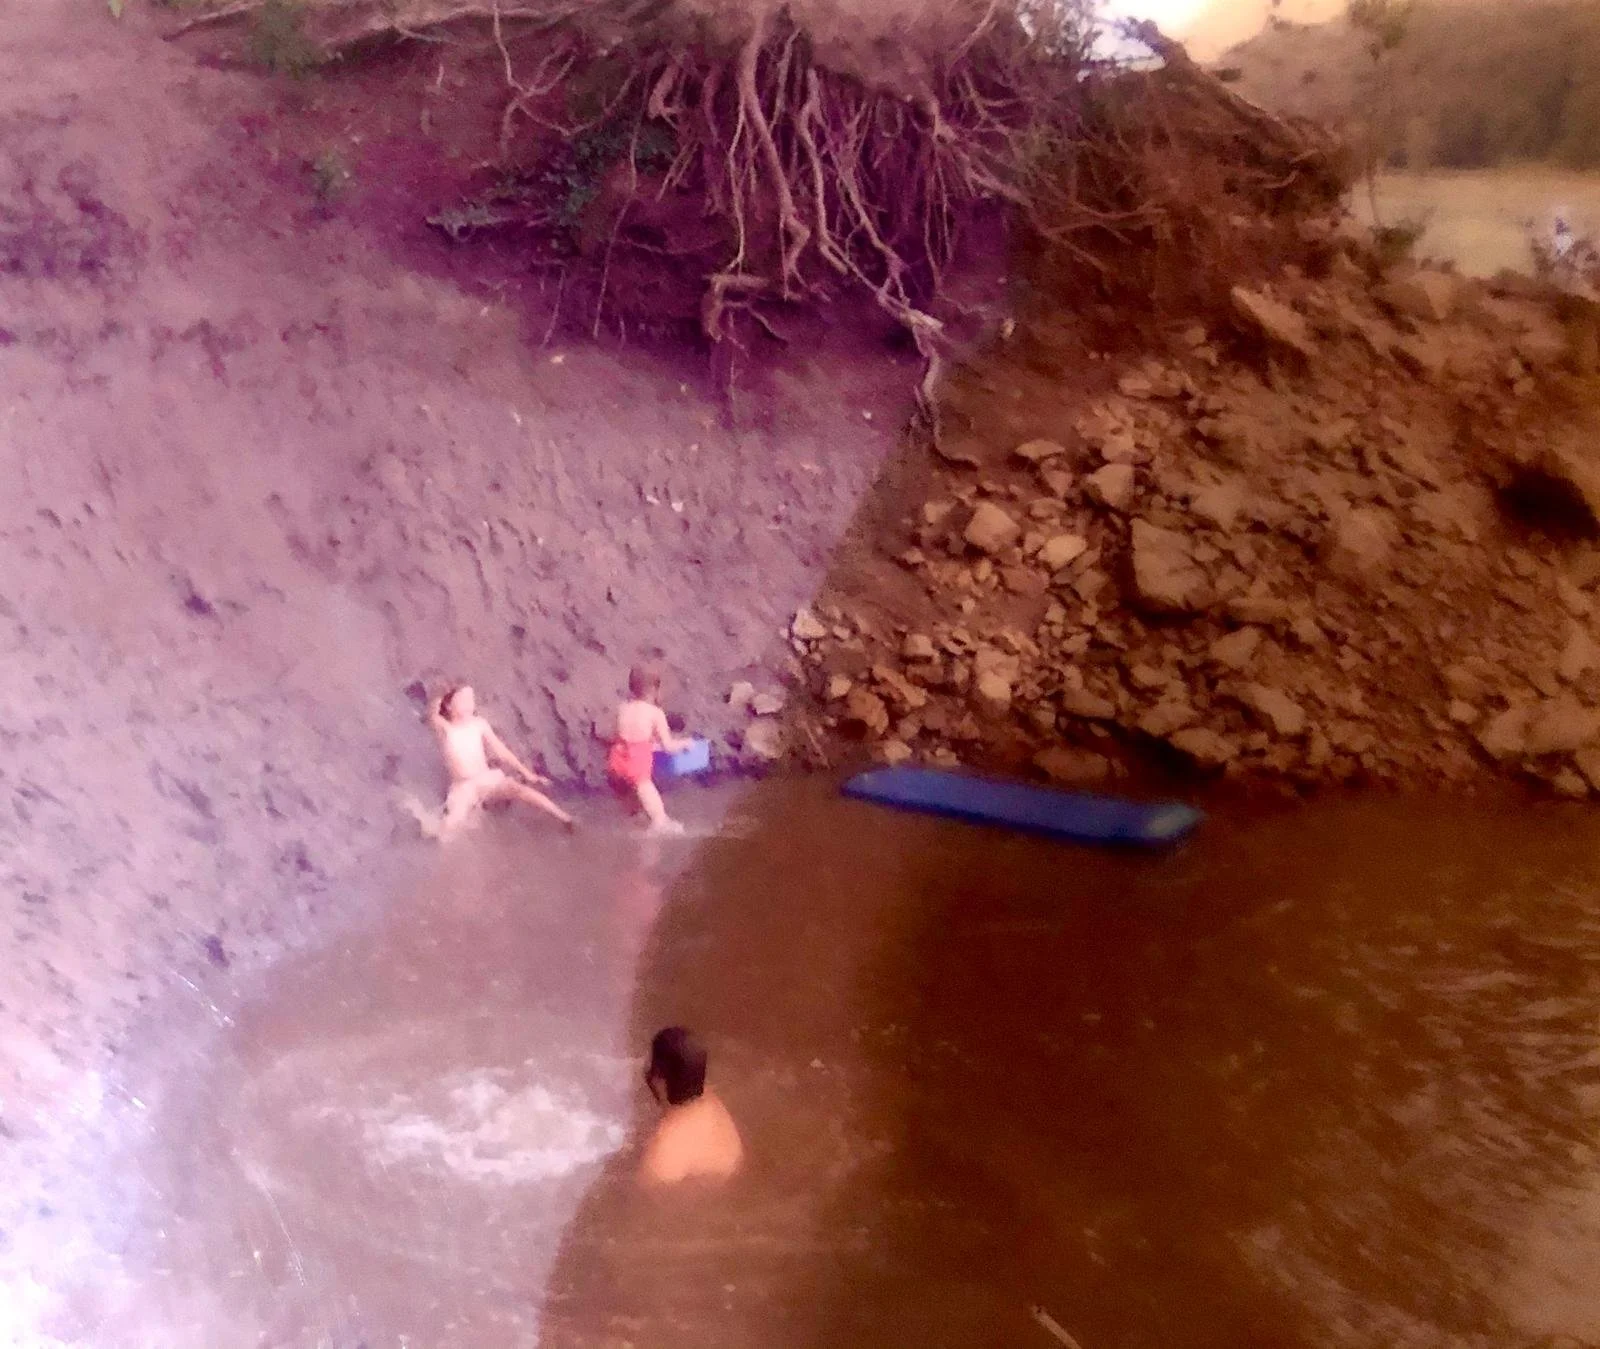
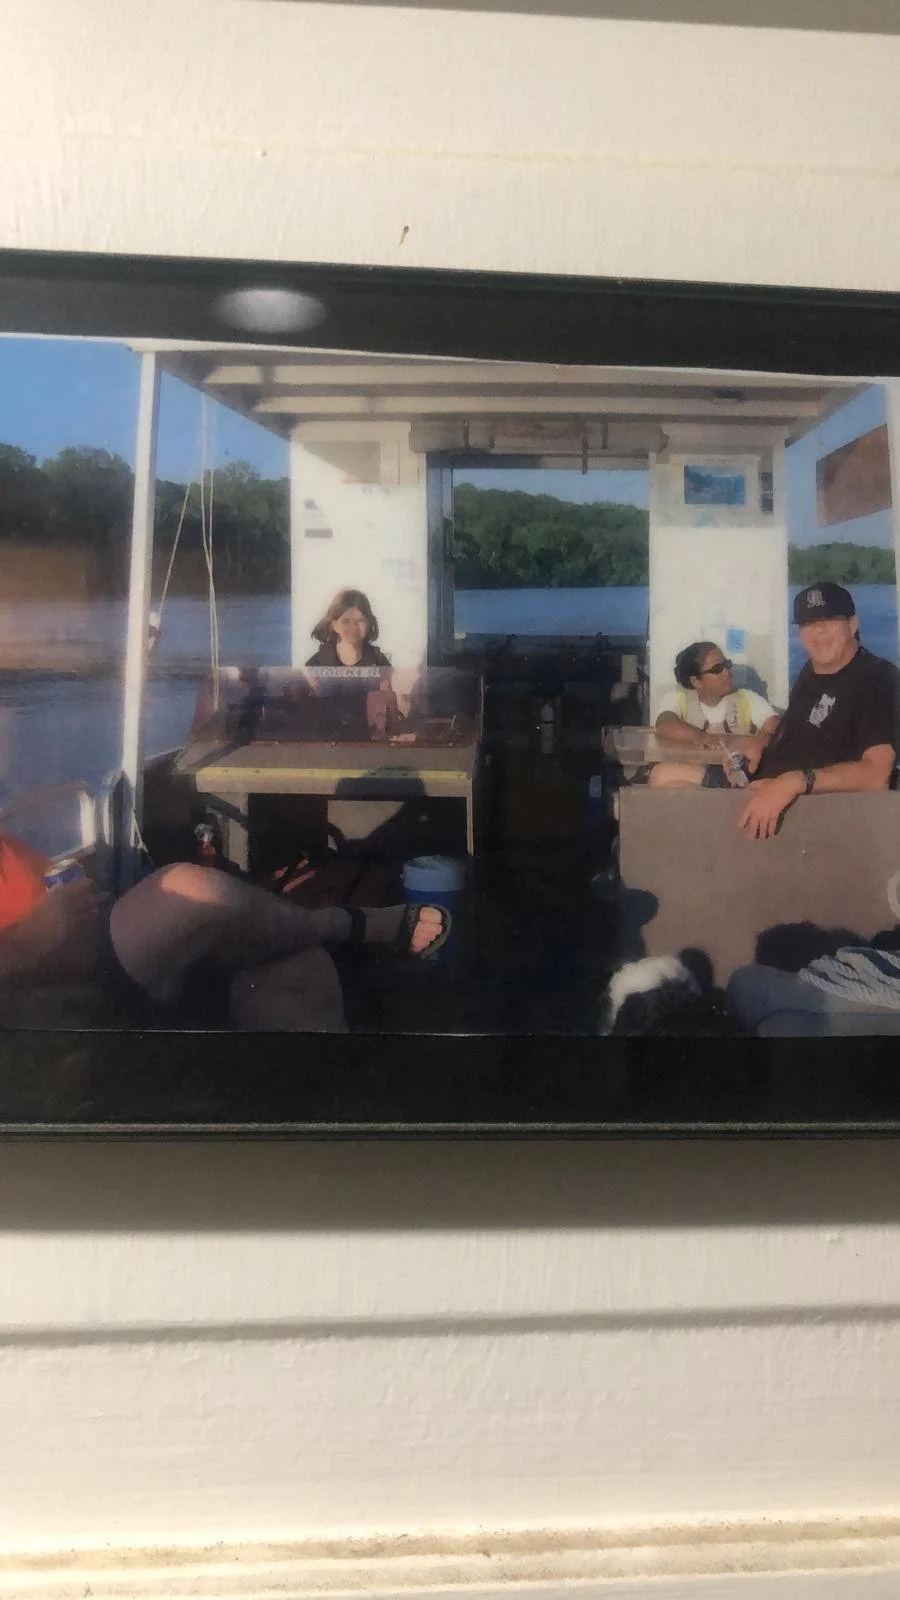
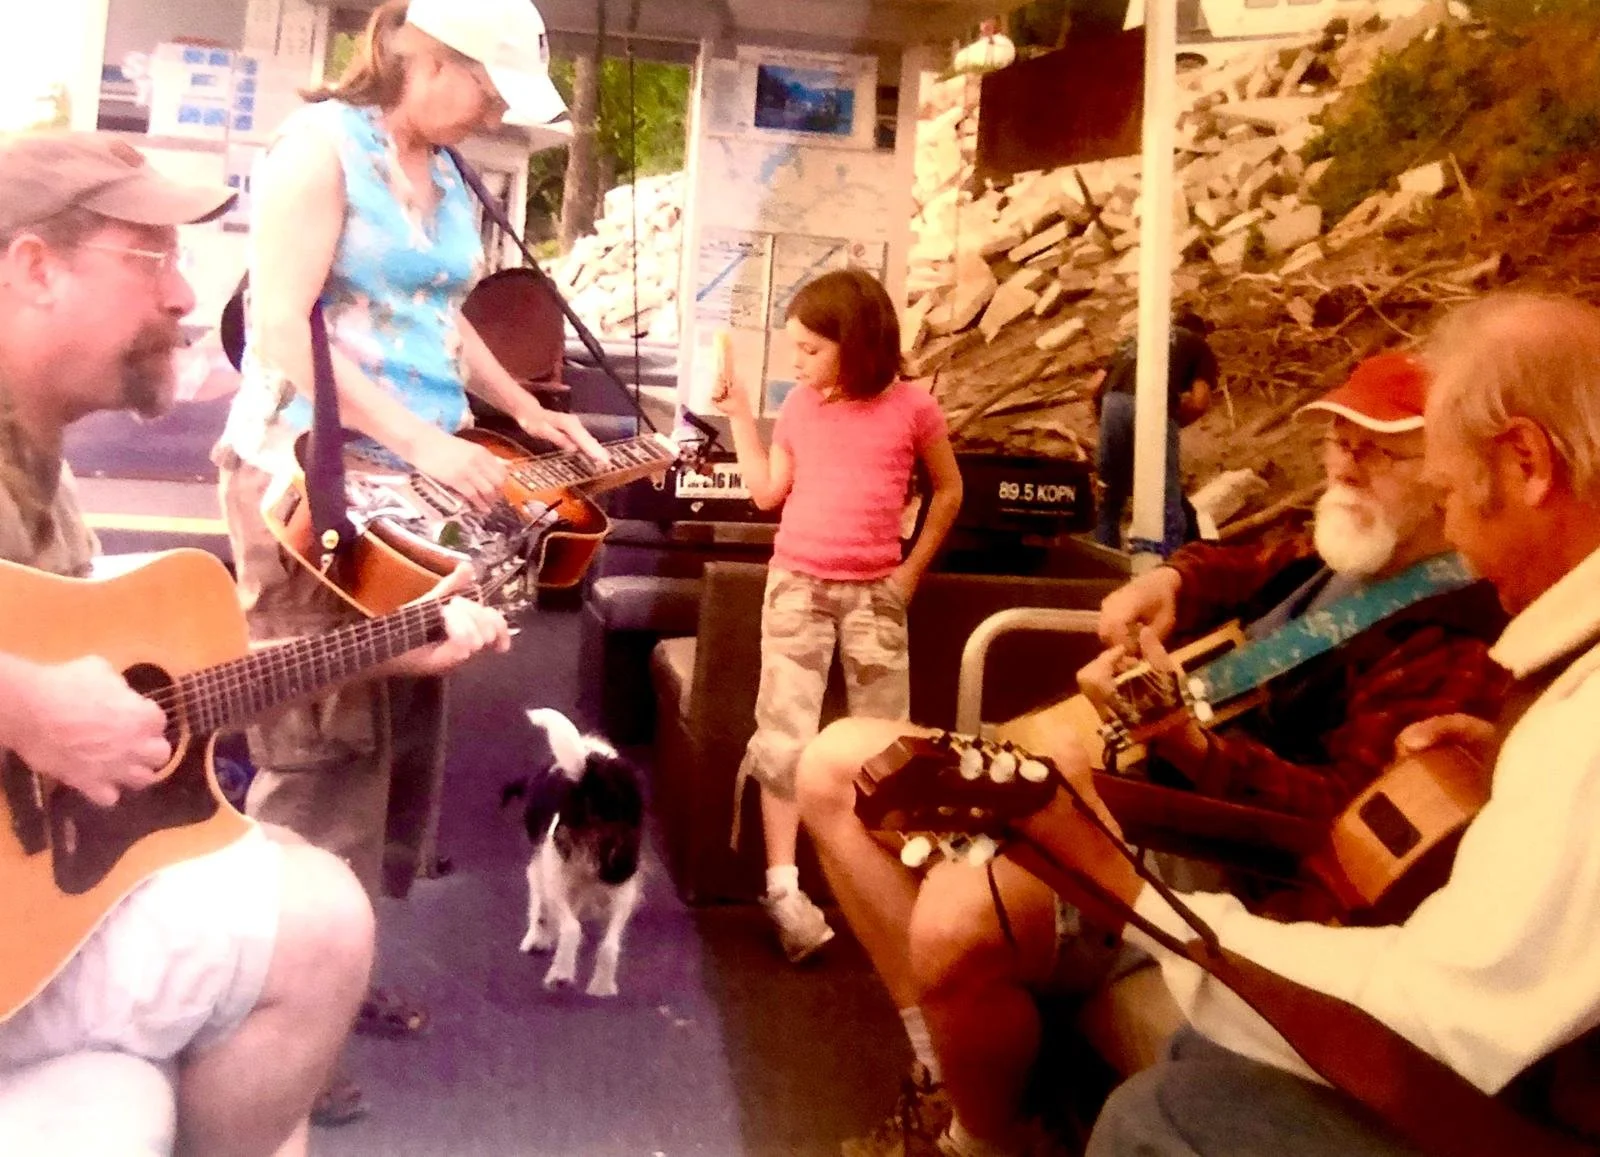
I was lucky enough for my childhood to coincide with a golden age of Cooper’s Landing. It was a period where all the River Rats (where exactly this term derives, I to this day, do not understand as I have never spotted a rat in my time on the river. I have spotted lots of beavers, grey herons, Chinese catfish, even snakes, but never a rat or a mouse) brought their similarly aged children to play, dance, swim, and adventure together and the community of adults consisted of regulars who had been living on and around the river for a good portion of their lives.
House boats, pontoon boats, canoes, kayaks, camper vans and RVs, mobile homes, boat ramps, big trucks, live music, beer, fishing poles, and all the other typical Mid-western country staple accessories were contrasted by Chim’s Thai kitchen – a restaurant run by a Thai family that transplanted all nine of themselves to the middle of America – and a worldly travelled Jew (my father) and his daughter (me).


What I experienced growing up around Cooper’s Landing and The Big Muddy was really only something I began to appreciate later, moving to Singapore and then London (and of course growing up along the way) and recounting stories that I am sure to this day my close friends don’t believe as they sound straight out of ‘The Ozarks’ or ‘Winter’s Bone’ or some other television series or novel narrating dramas of isolated communities in the USA.
While the River Rats were of course lawless, uneducated, unpolished, and I am sure at times engaged in questionable and illicit activities behind the scenes, we were also rag tag group of genuine, brave, non judgemental, resourceful, and environmentally friendly people. I have stories from these days to create a novel or a series of my own, but the point of this piece is actually separate, so enough with memories. Let’s recap my first look into using a new (to me) web-based tool and exploring datasets available through google earth engine (GEE).
GEE
GEE is a cloud-based platform for planetary-scale geospatial data analysis, offering a vast catalog of satellite imagery and geospatial datasets’. This basically means that google has a lot of data on our natural environments. This includes temperatures, precipitation, land-use, vegetation, populations, water levels, the list goes on to encompass just about anything you can capture via satellite infrastructure. They have kindly made it available open-source for free to enables researchers, non-profits, and scientists ‘to analyse large datasets to detect changes, map trends, and quantify differences on the Earth's surface for applications in environmental monitoring, resource management, and humanitarian efforts’.
This is a great – if not overwhelming – resource and I wanted to begin with something silly and easy so I (meaning me with the help of ChatGPT, not that this even needs to be overtly stated these days) thought why not look into flooding patterns of the Big Muddy in Boone County Missouri since my birth in the year 2000. This would be a personal and simple way to understand the workflow of wrangling these datasets – then moving forward I could start to tackle more relevant and detailed analyses according to my interests and my profession.
Workflow and my simple script
After creating a free google earth engine account (free if you are a student or independent researcher or doing things non-for-profit, google seems to want to charge enterprises of course), you can connect to the available datasets through an API in about three lines of code.
Since I rarely program and haven’t opened visual studio code since university, I opted for the web-based colab environment which is very similar to Jupyter notebook. Rather than me attempt to explain everything properly please just look at the earth engine setup free and open source here if you are interested.
So, first I needed to locate the dataset and isolate Boone County, my area of interest.

Screenshot of output, with yellow outline isolating Boone County, and the purple outline representing a 5km buffer around the Missouri River (Big Muddy) banks to ensure that impacts of flooding on creeks off-shooting from the main river are adequately captured.
After setting up the geometry of the county and the river, I found a dataset that tracks surface water changes over time. I set up the analysis period to overlap with my time on earth so far: 2000 to present. Then we ranked the years by severity (the year with the greatest seasonal increase in surface area of water).
| index | flood_km2 | year |
|---|---|---|
| 0 | 64.416 | 2019 |
| 1 | 33.626 | 2010 |
| 2 | 33.324 | 2008 |
| 3 | 33.132 | 2001 |
| 4 | 32.775 | 2015 |
| 5 | 31.133 | 2005 |
| 6 | 30.868 | 2007 |
| 7 | 30.825 | 2009 |
| 8 | 26.388 | 2016 |
| 9 | 24.463 | 2004 |
| 10 | 23.07 | 2011 |
| 11 | 22.535 | 2013 |
| 12 | 22.347 | 2020 |
| 13 | 21.51 | 2002 |
| 14 | 20.094 | 2003 |
| 15 | 20.038 | 2014 |
| 16 | 18.959 | 2018 |
| 17 | 18.861 | 2012 |
| 18 | 18.036 | 2006 |
| 19 | 17.041 | 2000 |
| 20 | 15.013 | 2017 |
| 21 | 14.29 | 2021 |
2019 was the worst flood without a doubt, and by this time I had already moved out of Boone County for some time. I did a bit of further research which showed that winter precipitation reached record highs that year across the mid and north-West (where the Missouri river originates), coupled with a warmer winter that caused snow and ice to melt. Unfortunately, although the temperatures were higher than normal, the flood waters swept across soil that was still frozen quite hard from the winter and wasn’t able to absorb as much moisture to temper the rush of water. Many levees built in different states, including Missouri, to hold back flood waters broke.
The other top flood years were all clustered around a value, So although number two is technically 2010, the year of the flood that is etched so vividly in my mind (2015, more on that another day) wasn’t too far off.

Bright blue outlining the surface water included in flooding calculations, and pale blue and dark blue representing the number two and number one worst flood respectively.
Looking specifically at 2019 and 2010, I then mapped the surface area monthly throughout each year to see if there were any patterns in terms of seasons. Generally, seasonal flooding on the Big Muddy peaks in the spring and summer (May through October), driven by a combination of snowmelt from the Rocky Mountains and heavy rainfall from mid-continent thunderstorms. From the graph below of the top two flood years, this pattern isn’t all that clear as you might expect, potentially for three reasons. First, the top two floods could be considered abnormal by definition and clearer patterns diluted by whatever events happened in 2010 and 2019 to cause more severe flooding. Second, in general plotting just one year of data from a dataset of 80 years is not necessarily the best practice. Third, and the most common rationale for any and all climate analysis that doesn’t seem to make as much sense as it should is that warming temperatures disturb nature’s habits. While in 2010 the flooding seemed more cyclical within a lower level, 2019 flooded throughout the whole season, with levels even higher in peak summer.

Plotting the water levels of the two worst flood years to inspect any monthly patterns.
I accessed another database to look at rainfall and temperature throughout the same years, overlaying them on a graph to inspect patterns.


Temperature is shown for anyone not familiar with Missouri’s climate – historically, summers are hot and humid, winters are cold and frozen, and spring and autumn is beautiful and moderate. Temperature follows a similar soft arc in both graphs above, and it’s still clear that 2010 water levels rose and fell much more than in 2019 where levels were more consistently high throughout the May-October season. Note the scaling difference between the two years on each graph when interpreting, however, in both years it wouldn’t be completely crazy to comment that rainfall lags flooding, which makes sense. The final two graphs below isolate seasonal rainfall and make this pattern more clear.


Further work
As I had outlined earlier, this was a light exercise simply meant to familiarise myself with GEE, the workflow, the datasets available, and to determine how accessible it is as a resource. To summarise my findings first from that perspective: GEE is easy to use, lots of online documentation and both GPT and Gemini prove quite useful. For more powerful and complex projects I might suggest using Javascript on the earth engine, although for my purposes python was entirely useful.
Looking at the conceptual and scientific outputs from this exercise, nothing too groundbreaking can be concluded. The Big Muddy is influenced by snowmelt and rainfall, although extensive human infrastructure has been developed to control water level rise beyond certain thresholds. It’s difficult to see anything too by simply inspecting the floods over the past twenty years in isolation.
This analysis was quite elementary given there are many other factors that influence the flooding of a river. The Missouri river specifically originates in Montana amongst snowy mountains and flows east to North Dakota before making its way South across the United States into the Gulf of Mexico. This means upstream activities and weather patterns from different climates, and across hundreds of kilometres, impact flooding in Boone County.
A proper hydrologist may start to look at soil datasets and land-use changes over and outside the period of 2000-2024. Not to mention looking at other rivers, such as the Mississippi, and seeing how flood years compare. It would also be useful to look into literature comparing seasonal patterns of rivers… all of this is beyond my domain of expertise.
Finally of course, it would be useful to look into the infrastructure developments over time on the Big Muddy. Human intervention dates back before the time of Huckleberry Finn in terms of building dykes to manipulate currents and deepen water levels to enable barges to transport goods and freight across the country. Dams, Bridges, excavation or flood barriers all impact water levels and patterns as well.
All of these factors could influence the flooding proxy we used of surface area of water in km2 and make it difficult to pinpoint exactly what might be causing changes over time.